BioCircuit: Turning Circuit Discovery into a Verifiable Learning Environment
Amit Prakash & Lalithadithya N
The biology of a language model
LLMs are blackboxes where the behaviour of the model is a mystery. Mechanistic interpretability tools bridge the gap by allowing us to see how models reason about a certain prompt within the model. Anthropic’s On the Biology of a Large Language Model and circuit-tracer identify interpretable features and map their interactions through attribution graphs. Studies with Claude 3.5 Haiku reveal evidence of intermediate reasoning, advance planning in poetry, and representations shared across languages. However, attribution graphs are approximations of the actual behaviors within the model itself, they replace the underlying MLP activations with a component which is more sparse. They suggest explanations that researchers test by changing the internal activations and observing the effects it causes.
Our environment turns this exploratory workflow into an RL environment for an agent. The agent studies another model, proposes candidate mechanisms, runs interventions and submits a circuit for evaluation. This evaluates how well an agent can answer the question of “What internal reasoning graph does the model use to answer this prompt?”
Can agents discover supernodes?
Attribution graphs are a DAG consisting of nodes and edges where each node is a transcoder feature at one token position of the prompt (written as layer_index, e.g. 30_8052). The edges are selected based on their contribution between layers and only the most important influential ones are retained as the graph is otherwise dense.
This is described in detail in the circuit tracing blog.
One of the central tasks when using attribution graphs is trying to group similar nodes together to identify features which activate on similar features (Eg. activating on a “basketball” feature). This group of nodes are termed as “supernodes”.
A feature can be both positively and negatively affected by a certain token too (Eg. if the context contains terms related to networking, the features related to electrical sockets may be activated negatively). This allows for many knobs which can be tuned when trying to interpret a prompt for a certain model.
A stronger experiment asks whether the same feature matters across several prompts expressing the same goal, including prompts the agent has never seen. It also asks whether unrelated behaviour survives the intervention. This is a much harder task and still somewhat subjective as to what counts as “good” classification.
Structure
We use Qwen3-4B as the model the agents inspect. It is a good starting point for our experiments as it is a fairly small model which also has pre-trained transcoders available for us to use. Inside the environment, we provide 3 tools for the agent to interact with this LLM.
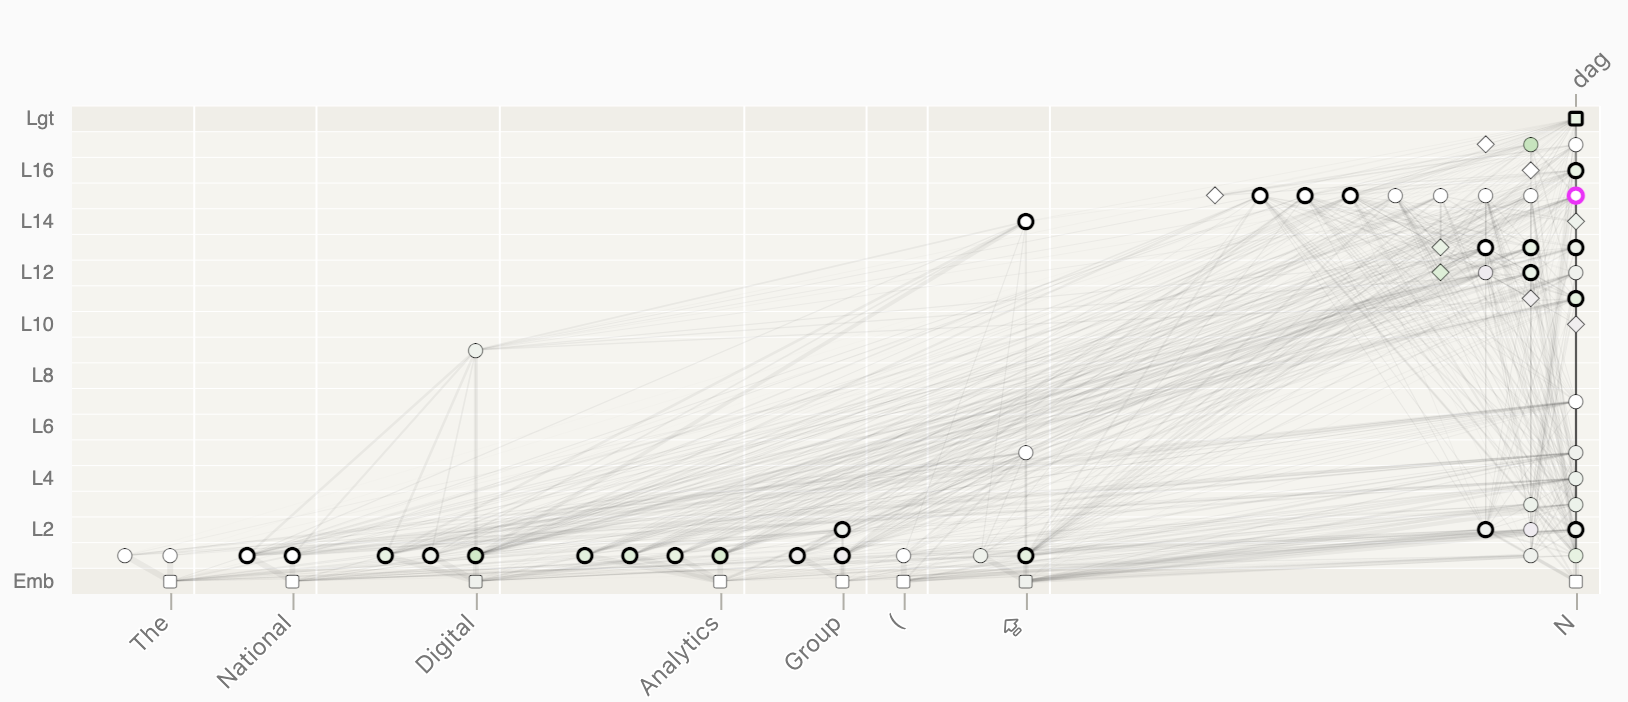
attribute: This is the standard attribution graph which is the starting point for any interpretability work. For those unfamiliar, this is where we generate attribution graphs for a certain prompt. The DAG along with the weights between the prompt tokens and the output token serves as a starting point. The visualization has more important nodes highlighted with darker shades. This tells us which layer and which position within the prompt the output token was most influenced by.query_graph: Read the attribution graph in pieces. A graph for one of our prompts has around 1,700 nodes and 300,000 edges, far too much to show at once, so the agent pages through the most influential features and looks up specific nodes.intervene: Allow the agent to change the multiplicative factor for a given set of nodes. This is usually used with the other two tools to make a further decision. This allows us to control the influence of a node on subsequent nodes which in turn affects the final output token. This is fundamental to testing hypotheses (e.g. does node12_568increase the likelihood of the output token beingDallas). It then runs the model on a provided prompt with the intervention applied, so the agent can observe how the behaviour changes. The details of this mechanism are explained in detail here.
This is more or less the standard way of inspecting an LLM and discovering circuits and it is restricted enough for us to be able to use the submissions and grade them.
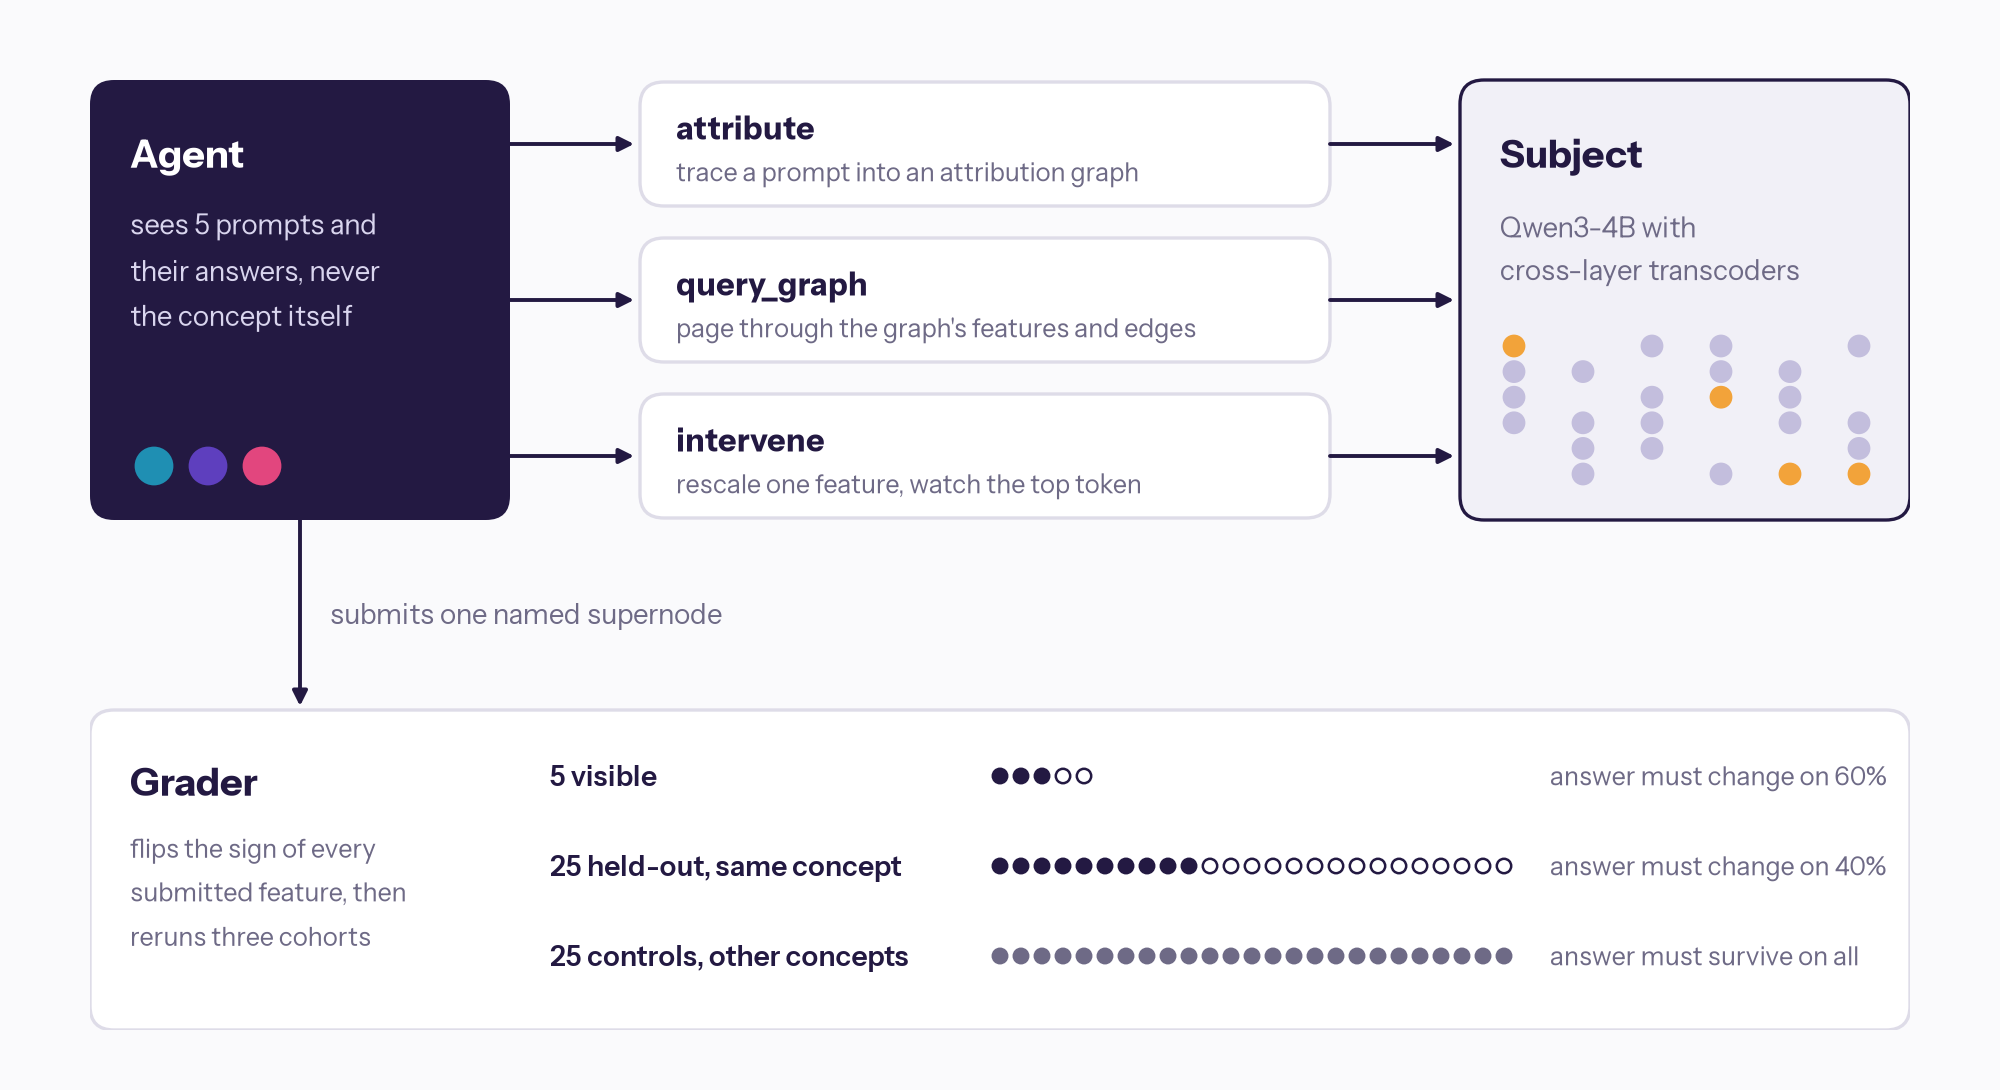
Three pillars of interpretability
Interpretability does not have a single fixed target, this makes it difficult to directly hillclimb on interpretability. It is also not feasible to preempt every possible interpretability use case, so we decided on 3 different tasks which all share the same base tools but with different goals in mind.
Circuit discovery
The agent receives five prompt-and-continuation examples without their stored semantic goal. It must infer what they share and submit exactly one supernode. The grader tests that proposal on the visible examples, 25 additional same-goal examples, and 25 different-goal controls. This task attempts to see if an agent can group supernodes which isn’t just a verbatim copy of the attribution graph by giving it varied graphs and ensuring it doesn’t just dump everything by using control graphs which don’t change.
This task is the most straightforward way of doing interpretability experiments and is the first one described in the Anthropic blog.
Supernode rediscovery
The agent receives a semantic goal but no example prompts. It must construct its own experiments, deciding what evidence would be informative before it has a graph to inspect. Positive cohorts contain at least two distinct full answers and controls can share answer tokens with positives. These choices help distinguish a goal related mechanism from a feature that simply promotes a particular answer.
This task is naturally very difficult to solve as it requires generating prompts which may activate certain nodes and suppress others without any guidance. The hidden set may never activate nodes which the model may have successfully discovered either. We calibrate a pass to a very low set of hidden prompts being identified because of this, we still enforce stable control prompts since the submitted nodes still shouldn’t be disruptive.
Suppressed-feature restoration
The model is evaluated under a persistent hidden corruption. The agent proposes activation multipliers intended to recover clean behaviour. The agent only gets to interact with corrupted model so it is never aware of how the model normally behaves. This task is the easiest one as the agent can find the mislabeled nodes purely by inspection, this still requires it to deconstruct other prompts since the suppressed prompt wouldn’t show up in the traces.
Rewarding submissions
A circuit’s description can sound convincing without surviving a causal test. Grading the quality of a certain intervention is something which has no single correct method. The lack of an oracle solution to the tasks also makes it more difficult to directly measure how good a solution is. We design proxies for measuring the quality of a solution by using a dataset generator by sampling from a fixed set of prompts all of which are semantically similar.
The one caveat to this approach is that any dataset sample has no guarantee that they all activate the same set of nodes in the model, in fact they might all be disjoint. There is no way to completely eliminate this, but from empirical observations, this is usually not the case and the added benefit of having an infinite set of examples the tradeoff is well worth it.
Discovery-style tasks
Every prompt ends right before a one-token answer (e.g. Austin), and the most likely next token, the top token, is the model’s answer. If a supernode really carries the concept, reversing its features should change that answer on prompts of the same kind, while the answers to unrelated (control) prompts should stay the same. So a positive example succeeds when the intervention displaces the original top token, and a control succeeds when its original top token remains first.
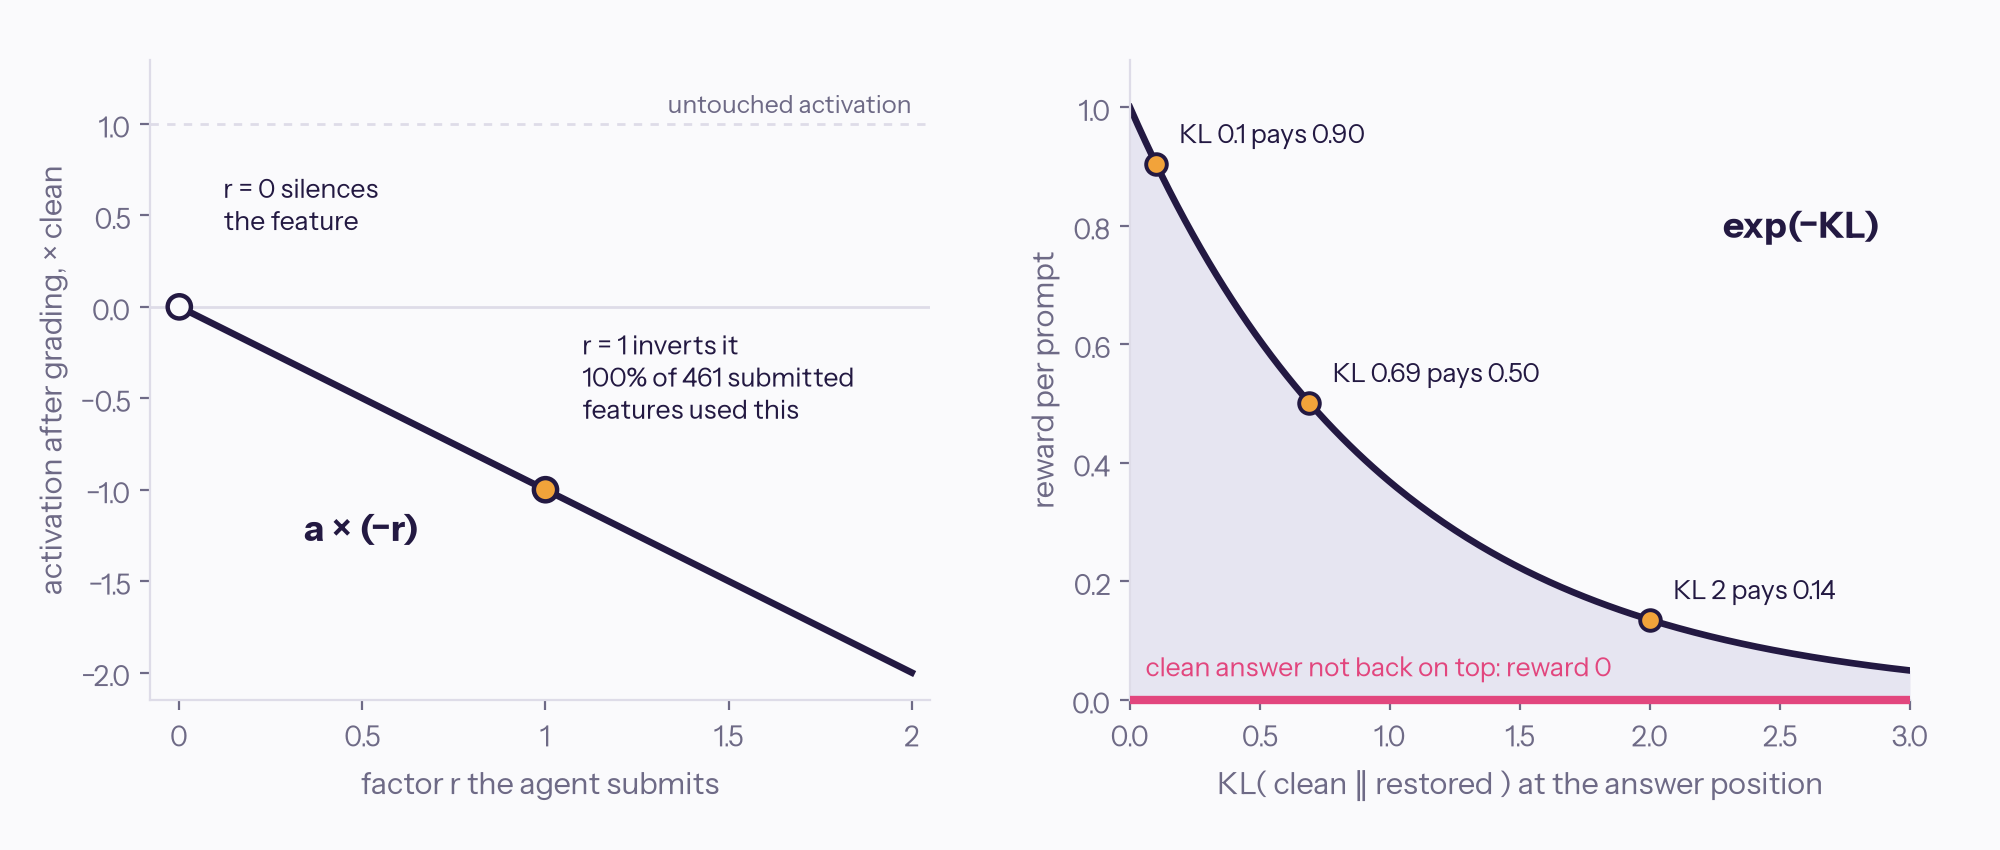
The agent submits a factor with its supernode, describing how strongly its features push towards the answer. We use the negative of this factor, so the grader tests what happens when the features push the other way:
A factor of one reverses the activation’s sign. Zero clamps it to zero. This is not equivalent to always deleting the selected features.
We binarise the reward for evaluation. This requires the submission to pass 60% of visible examples and 40% of held-out examples, while allowing no control failures.
Restoration
Restoration requires another layer to account for the hidden corruption which is applied before any inference takes place. With clean activation , hidden corruption , and proposed restoration , the backend applies:
For each example, the clean target must first return to the highest probability position. If it does, the score measures recovery of the full final token distribution:
The final reward averages this score across the hidden corrupted cohort. We score based on the KL divergence since the model could just produce a very skewed distribution which might work for the provided examples but not generalise well to other prompts.
Data generation
As mentioned before, we generate synthetic prompts from defined families, inference the model for completion, and retains examples where the continuation matches an existing set. We then compute attribution graphs and checks that the graph’s top exported token matches the sampled target token. Additionally, error nodes represent computation not captured by the interpretable approximation. If their influence is high, a feature-based explanation is harder to trust.
All downstream tasks are then just different collections of these examples. For example, visible discovery is 5 examples from the dataset, 25 hidden, and 25 control tasks which we use for validation. Similarly, we do the same thing for the other tasks by sampling and collecting them into one of 3 sets.
Restoration has another step where the builder searches for shared features across a cohort, samples a corruption involving 4–12 features, and retains it only if every selected prompt changes its top token. This creates a persistent disruption across examples which makes it solvable.
We specifically select examples the subject can answer correctly and whose graphs pass screening. Performance on these examples cannot automatically be generalized to all prompts or internal mechanisms, future work might involve trying to optimize the transcoder itself or using prompts where the top token is hallucinated.
Results
We ran three agents on the circuit discovery task: Kimi K3, Fable 5.1 and GPT-6 Astra. Each agent got the same 16 tasks with two rollouts per task, so 96 rollouts in total. The other two tasks (supernode rediscovery and suppressed feature restoration) are not covered here.
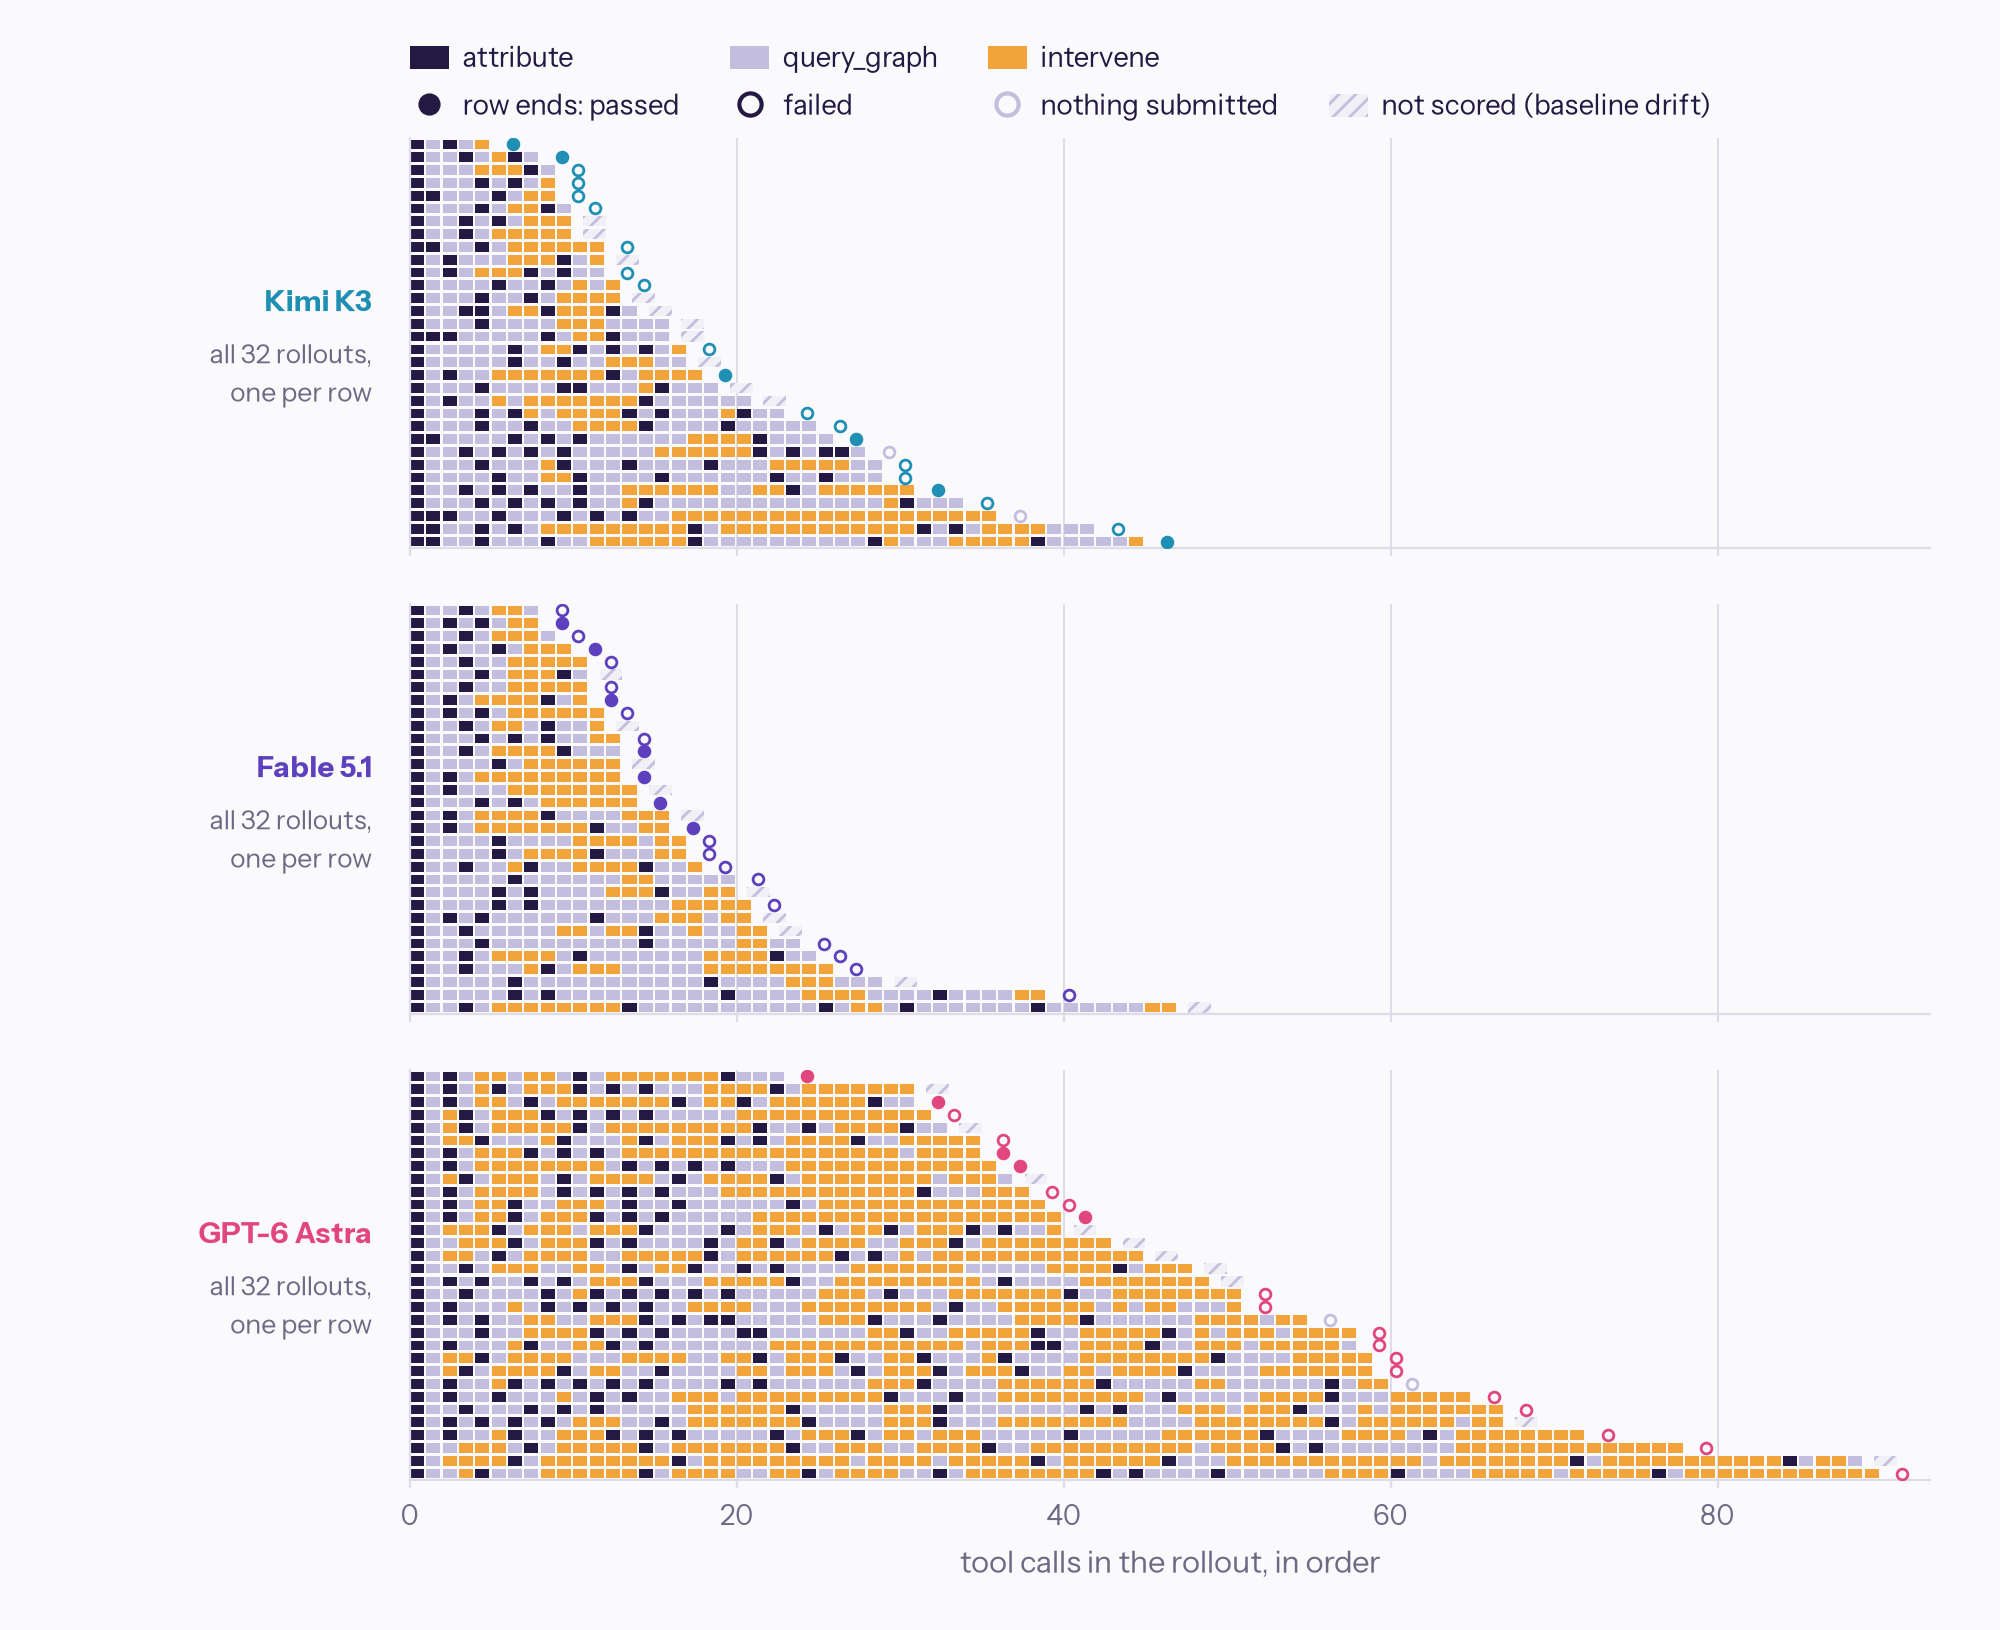
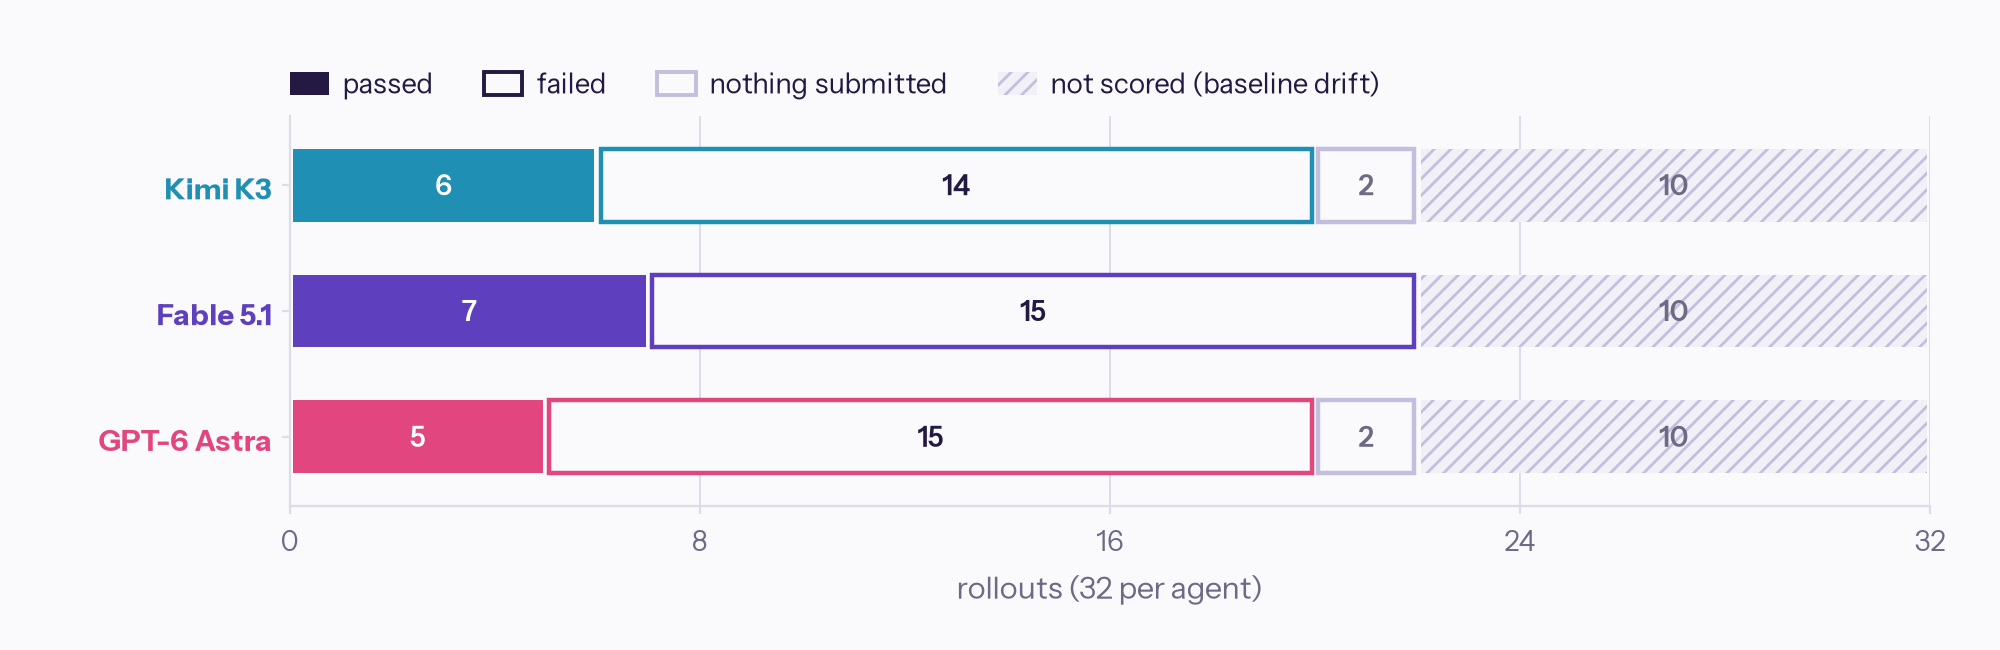 Baseline drift: before scoring, the grader reruns each prompt without any intervention and checks that the model still gives the answer stored in the dataset. On these five tasks it no longer did, so they could not be scored. This depends only on the task, not the agent, which is why the same tasks drift for every agent.
Pass rates by task
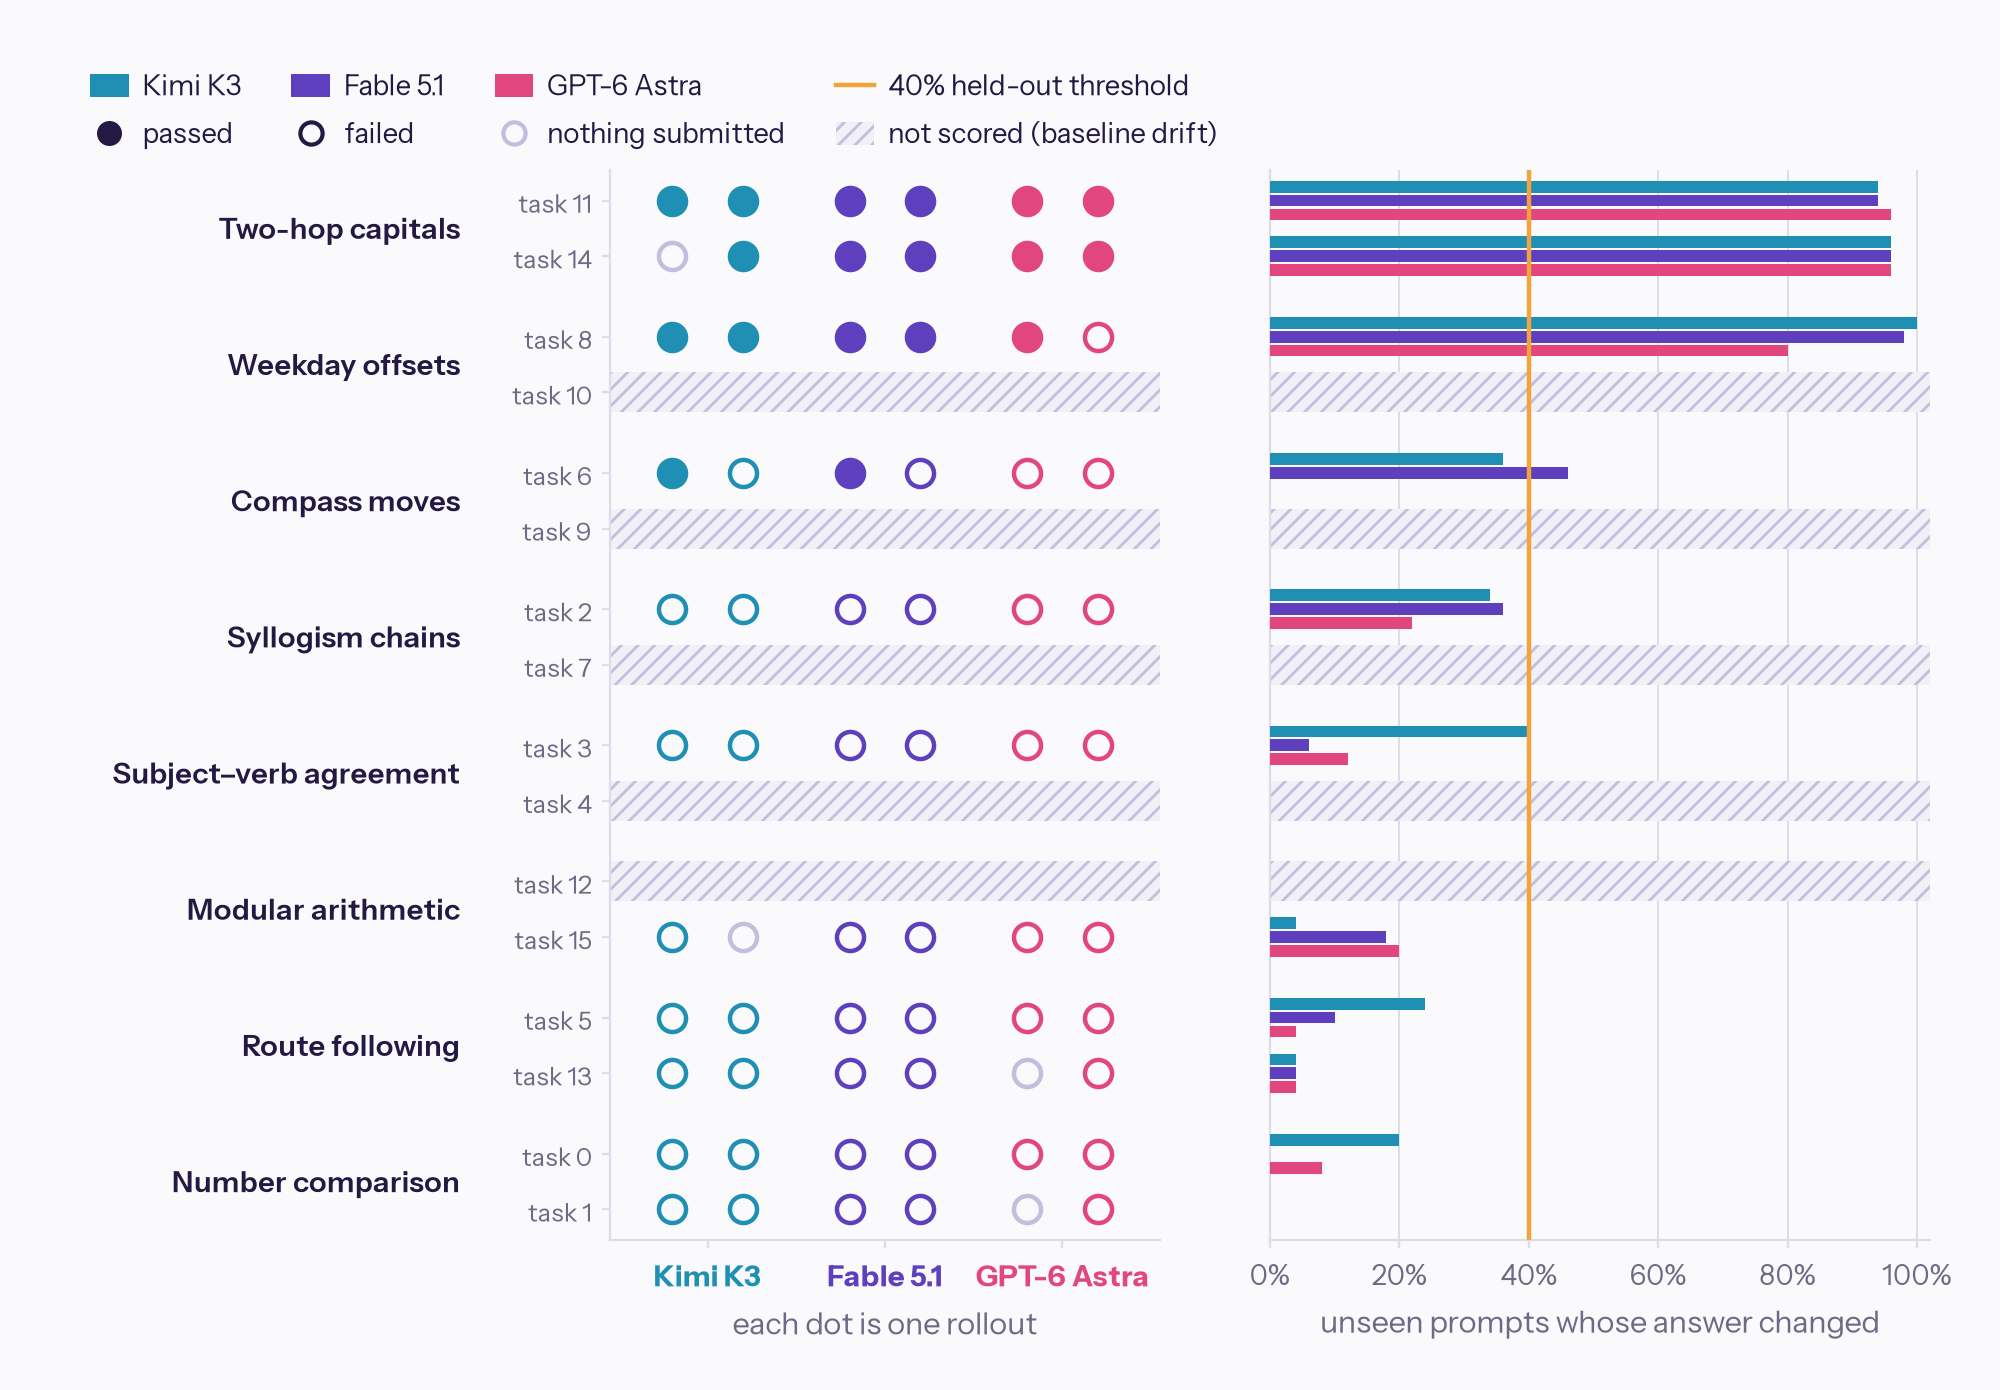
Most of the passes come from Two-hop which has been explored extensively and is part of the circuit tracer tutorial. All the other tasks are ones which do not have existing obvious solutions.
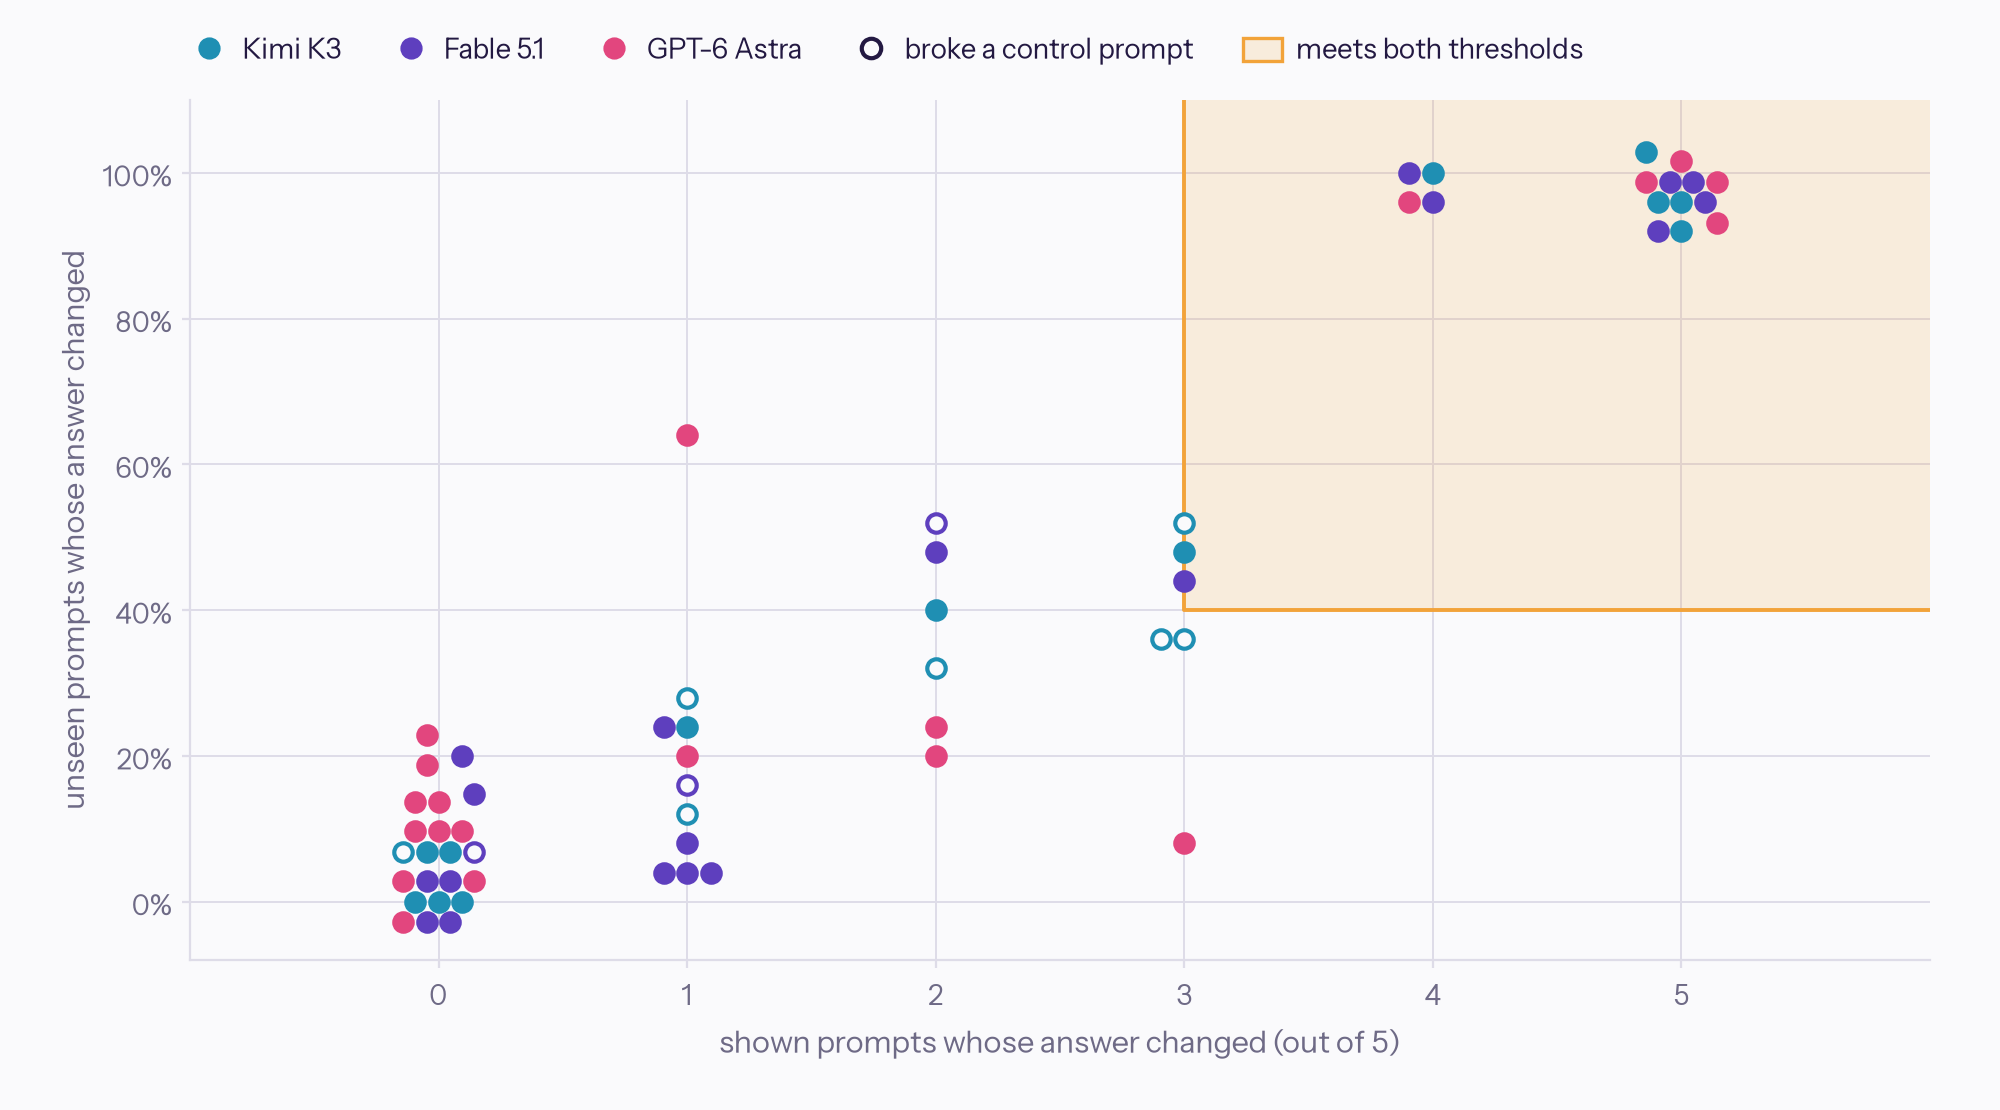
One feature explains most of the broken controls. It was submitted 8 times across syllogisms, agreement and route following, and all 8 submissions broke control prompts. Only 2 control failures happened without it. In one compass rollout Fable noticed the same feature fire on a colour-mixing prompt so chose to leave it out which allowed it to pass.
On two-hop capitals, a third of the changed answers became the region instead of its capital: Lisbon turned into Portugal 31 times, and we saw the same for Florida, France and Japan. The supernode sits on the region-to-capital step and the first hop is left standing. This matches the Dallas, Texas, Austin example in the Anthropic post, this was the only one where they successfully managed to modify the model.
Feature selection
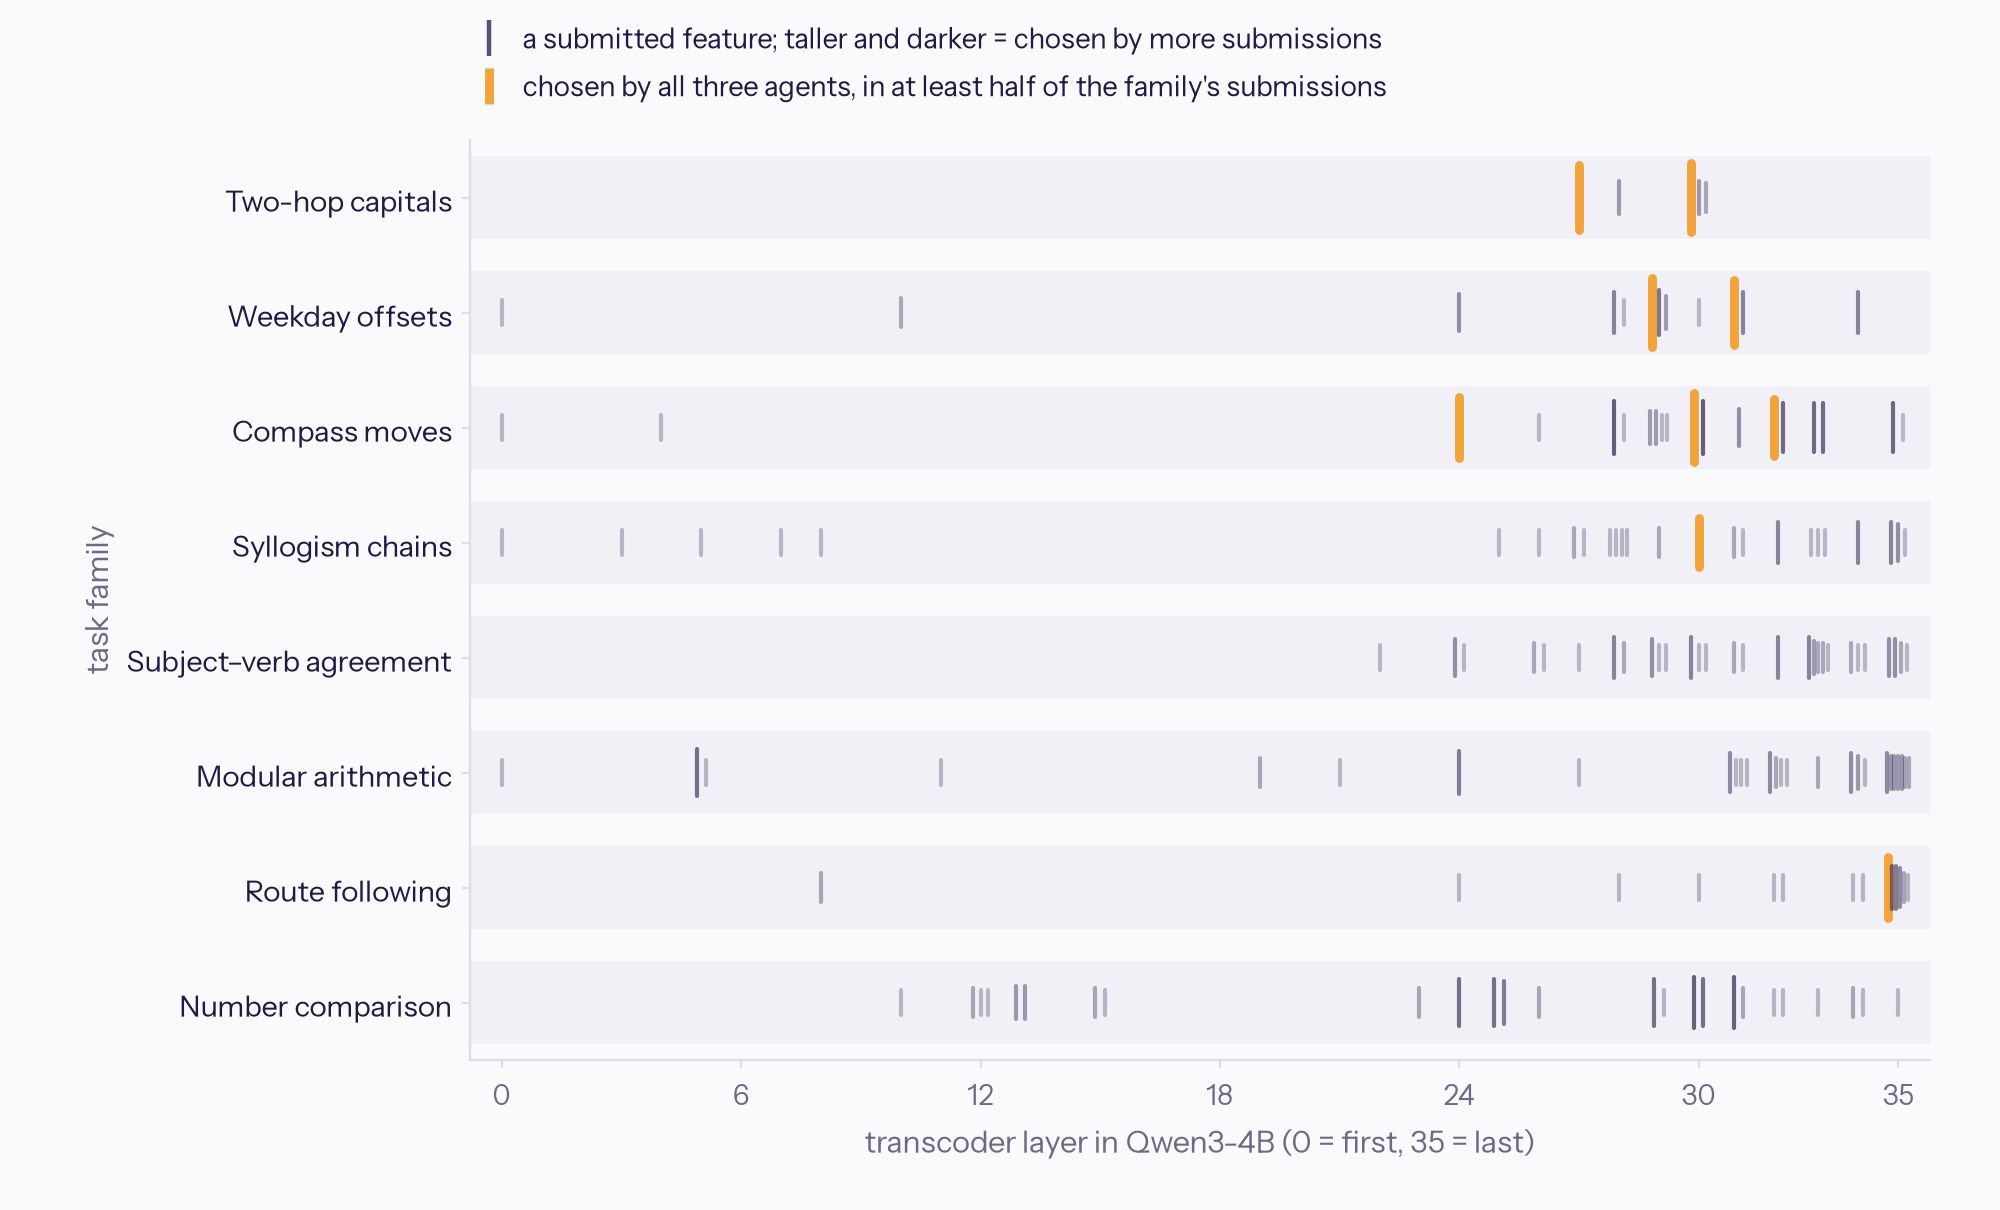
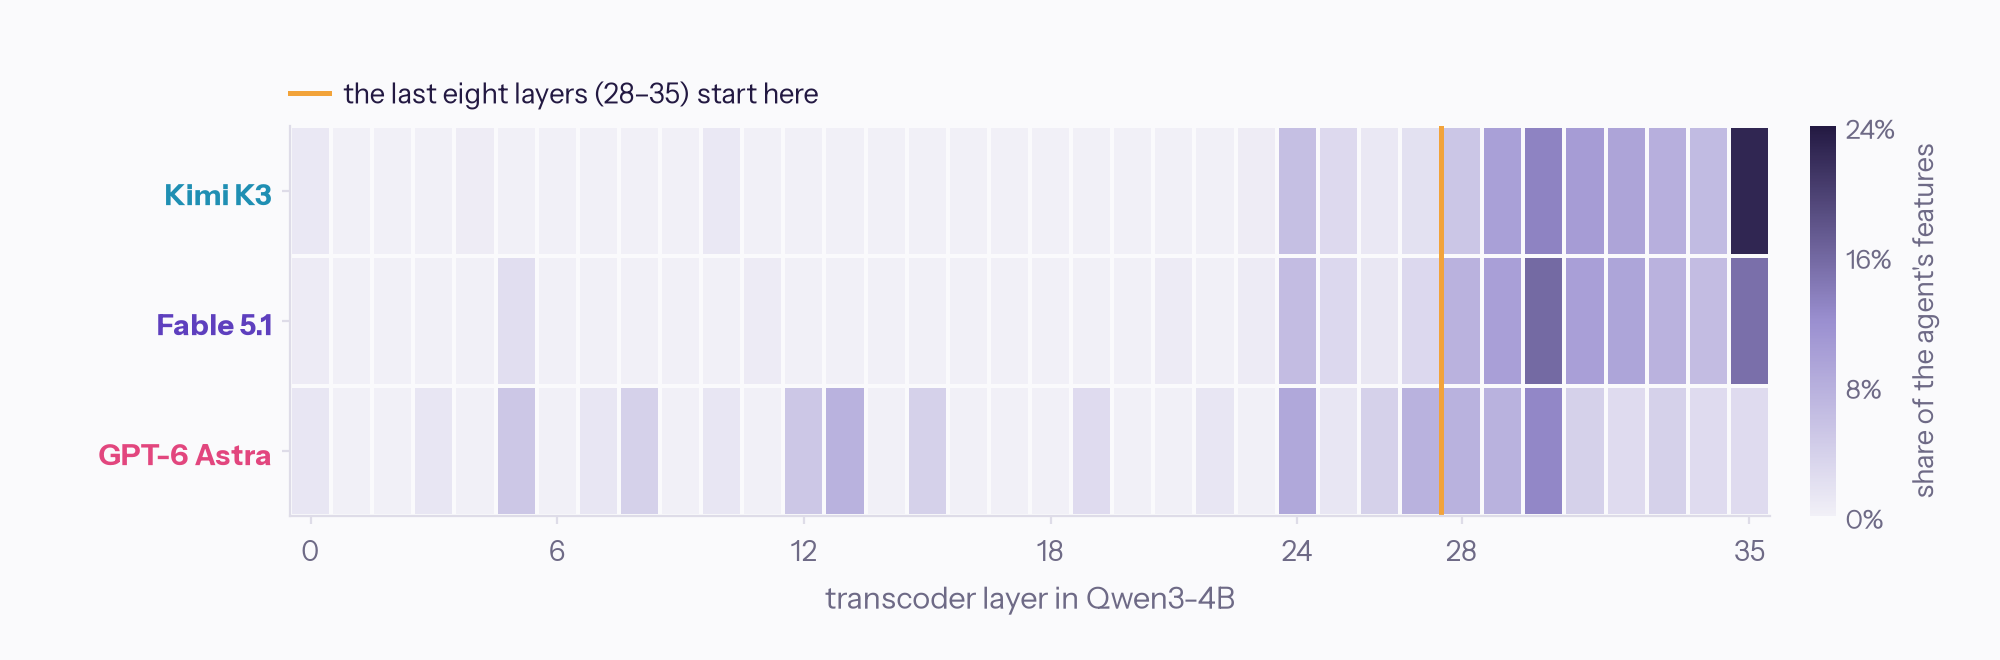
Agents tend to pick the same feature across rollouts, this suggests that they are able to reason about the features, but they rarely account for more complex dynamics which results in a lot of them failing regardless.
Tool usage behavior
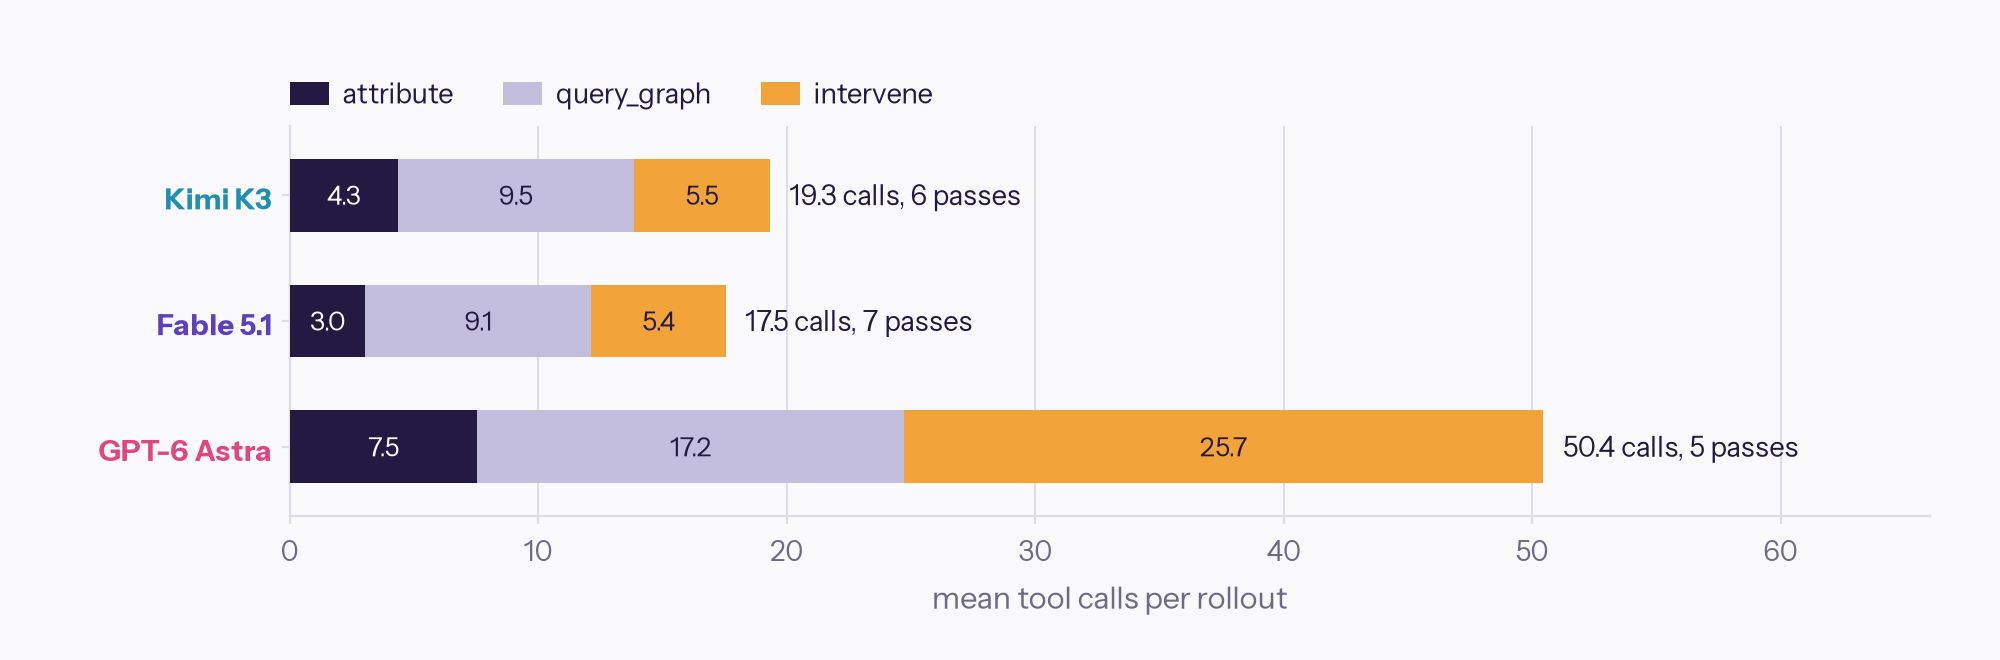
Astra tends to use tools way more often than Kimi and Fable across the board, but this doesn’t really result in any better scores.
What the experiments show
These are the observations we derived from the rollouts and they hold across all three agents:
- Agents can find features the model actually relies on for some concepts. On two-hop capitals and weekday offsets, the passing supernodes changed the answer on 92–100% of prompts the agent never saw, without changing any control answer.
- Naming the concept is not the same as finding it as every submission named its concept correctly.
- Control prompts catch generic features.
- Tool Call efficiency : More tool calls did not lead to better circuits. Astra made the most calls and passed the fewest rollouts.
Future work
A high reward is evidence about behavior under a specified intervention and evaluation set. But it doesn’t mean the agent can perform interpretability across all shapes it encounters. For example, our environment does not cover the following
- Changing the top token does not establish that a feature group fully represents a concept. The intervention might act on a downstream answer-selection mechanism. Preserving sampled controls does not establish preservation across every unrelated behavior.
- Supernode names are interpretations supplied by the agent. The grader does not independently verify those labels, and a successful group is not necessarily minimal or uniquely correct. This would expose limitations of the transcoder itself rather than the model’s capability in this case.
- Recovering the clean distribution need not mean the policy identified the original corruption exactly. It may find another intervention that compensates for the damage. This is acceptable, but might not get the model to identify “suspicious” nodes.
Ideas behind this post
- On the Biology of a Large Language Model
- Circuit Tracing Blog
- https://github.com/decoderesearch/circuit-tracer
- https://huggingface.co/collections/mwhanna/qwen-3-transcoders
- https://www.neuronpedia.org/
Acknowledgements
Matej Sirovatka, for being my peer, discussing ideas with me and guiding us.
Snimu (Sebastian Müller), for coordinating the residency and providing the compute and guidance whenever we requested them.
Thanks to Prime Intellect for the Prime Residency program. Thanks also to the Prime Intellect team for building such great infrastructure as this work would not have been possible without their infrastructure.
#Biocircuit #Interpretability #Circuit-Tracing #Rl-Environments