PyTorch Forum Topic Analysis
Comprehensive analysis of 73,000+ PyTorch Forum topics using semantic embeddings, unsupervised clustering, and interactive visualization
Project Overview
This project demonstrates advanced data science techniques applied to real-world forum data, showcasing the power of semantic embeddings and unsupervised learning for understanding large-scale text collections.
Dataset
- Source: PyTorch Community Forum
- Format: JSONL with topic metadata
- Volume: 73k+ topics across multiple categories
- Fields: ID, title, category, views, replies, dates
Pipeline Architecture
flowchart TD
A[JSONL Data
73k topics] --> B[DataLoader
Clean & Validate] B --> C[EmbeddingGenerator
all-MiniLM-L12-v2
384-dim vectors] C --> D[ClusteringEngine
K-Means + HDBSCAN] C --> E[VisualizationGenerator
UMAP/t-SNE + Plotly] D --> F[EvaluationEngine
Metrics & Validation] D --> G[ClusterAnalyzer
TF-IDF + Word Clouds] D --> H[AdvancedAnalyzer
Temporal Trends] F --> I[Interactive Report] G --> I H --> I E --> I style A fill:#e1f5fe style I fill:#c8e6c9
Technical Implementation
Processing Workflow
graph LR
A[Load JSONL] --> B[Clean Data]
B --> C[Generate Embeddings
384-dim vectors] C --> D[Find Optimal Clusters
K-Means silhouette] D --> E[Create Visualizations
2D/3D plots] D --> F[Analyze Clusters
Keywords & patterns] E --> G[Generate Report] F --> G
384-dim vectors] C --> D[Find Optimal Clusters
K-Means silhouette] D --> E[Create Visualizations
2D/3D plots] D --> F[Analyze Clusters
Keywords & patterns] E --> G[Generate Report] F --> G
Key Technologies
- Embeddings: sentence-transformers/all-MiniLM-L12-v2 (384-dim)
- Clustering: K-Means with auto-K selection, HDBSCAN optional
- Visualization: UMAP/t-SNE + Plotly interactive plots
- Analysis: TF-IDF keywords, temporal trends, word clouds
End-to-End Workflow
This project processes 73k PyTorch Forum topic titles through a complete pipeline:
- Load & clean JSONL data (
DataLoader) - Embed titles with Sentence-Transformers
- Cluster embeddings via K-Means (optimal k) or HDBSCAN
- Visualize clusters in 2D/3D (UMAP / t-SNE)
- Evaluate with silhouette, NMI, ARI metrics
- Analyze clusters: keywords, word-clouds, trends, correlations
- Report – you're reading it!
Data Files & Outputs
Directory Structure
graph TD
A[experiments/] --> B[embeddings/]
A --> C[clusters/]
A --> D[visualizations/]
A --> E[evaluation/]
A --> F[analysis/]
B --> B1[topic_embeddings.npy
topic_embeddings.json] C --> C1[kmeans_labels.npy
kmeans_meta.json] D --> D1[2d_clusters.html
3d_clusters.html] E --> E1[metrics.json
confusion_matrix.png] F --> F1[cluster_characteristics.json
word_clouds/
advanced/] style A fill:#e3f2fd style B fill:#f3e5f5 style C fill:#e8f5e8 style D fill:#fff3e0 style E fill:#fce4ec style F fill:#f1f8e9
Key Output Files
- Embeddings: 384-dimensional vectors in NumPy format
- Clusters: K-Means labels and metadata
- Visualizations: Interactive 2D/3D Plotly charts
- Analysis: TF-IDF keywords, word clouds, temporal trends
Interactive Visualizations
Explore clusters through interactive 2D and 3D plots with hover details and zoom capabilities.
Cluster Visualizations
Interactive scatter plots showing topic clusters using dimensionality reduction
Visualization Features
- Interactive Hover: View topic titles on mouseover
- Zoom & Pan: Explore dense regions and cluster boundaries
- Color Coding: Each cluster has distinct colors for easy identification
- Responsive Design: Adapts to different screen sizes
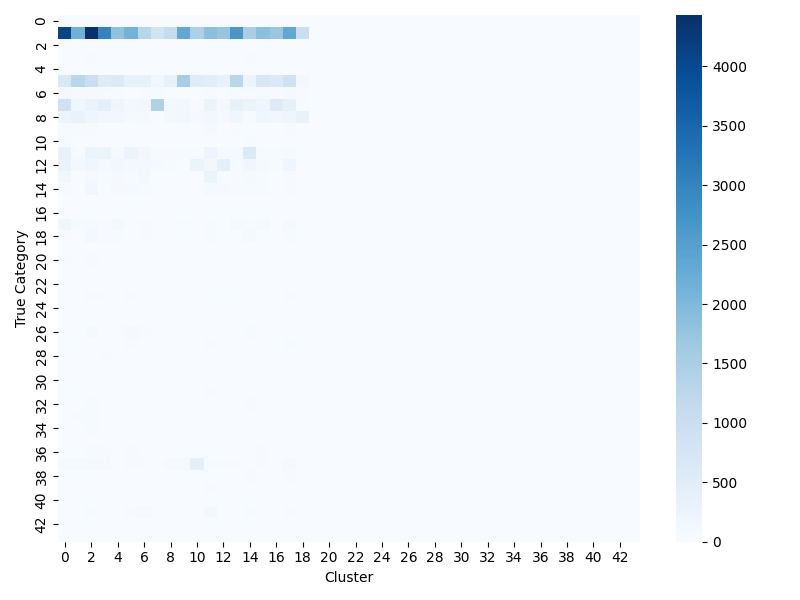
Clustering Evaluation
Metrics Overview
graph LR
A[Clustering Quality] --> B[Unsupervised
Silhouette Score] A --> C[Supervised
vs Forum Categories] B --> B1[Internal Cohesion
Cluster Tightness] C --> C1[ARI: Agreement
NMI: Information
V-Measure: Balance]
Silhouette Score] A --> C[Supervised
vs Forum Categories] B --> B1[Internal Cohesion
Cluster Tightness] C --> C1[ARI: Agreement
NMI: Information
V-Measure: Balance]
Key Metrics
| Metric | Range | Best | Measures |
|---|---|---|---|
| Silhouette Score | [-1, 1] | → 1 | Cluster separation |
| Adjusted Rand Index | [-1, 1] | → 1 | Agreement with truth |
| Normalized Mutual Info | [0, 1] | → 1 | Information sharing |
| V-Measure | [0, 1] | → 1 | Balanced quality |
Results
Cluster Analysis
Analysis Pipeline
graph LR
A[Clustered Topics] --> B[TF-IDF Analysis]
A --> C[Representative Titles]
A --> D[Word Cloud Generation]
B --> E[Top Keywords
per Cluster] C --> F[Cluster
Characteristics] D --> G[Visual
Summaries] E --> H[JSON Report] F --> H G --> H
per Cluster] C --> F[Cluster
Characteristics] D --> G[Visual
Summaries] E --> H[JSON Report] F --> H G --> H
Cluster Categories Discovered
- Technical: PyTorch modules, functions, APIs
- Domain-Specific: Computer Vision, NLP, Reinforcement Learning
- Problem-Solution: Debugging, troubleshooting, error resolution
- Educational: Tutorials, learning resources, best practices
- Research: Advanced techniques, academic papers, cutting-edge methods
Data & Visualizations
Word Clouds by Cluster
Hover over each word cloud to see cluster keywords. Size indicates term importance within the cluster.
Advanced Analytics
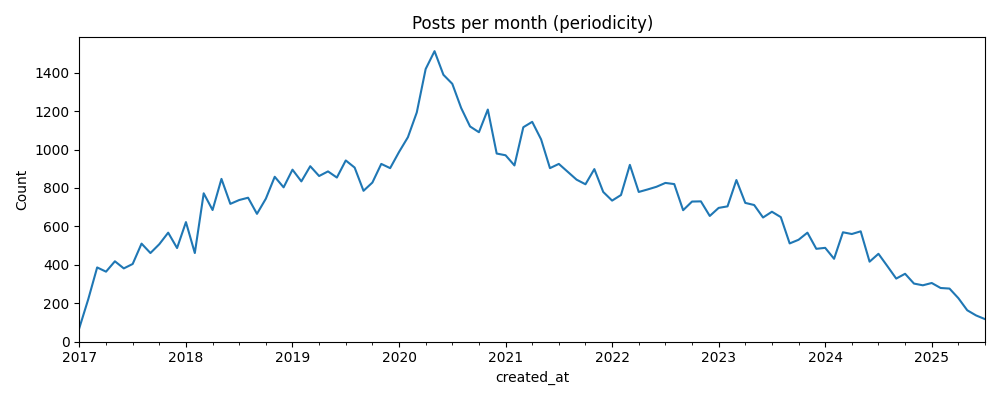
Temporal & Engagement Analysis
graph TD
A[Forum Data] --> B[Temporal Trends
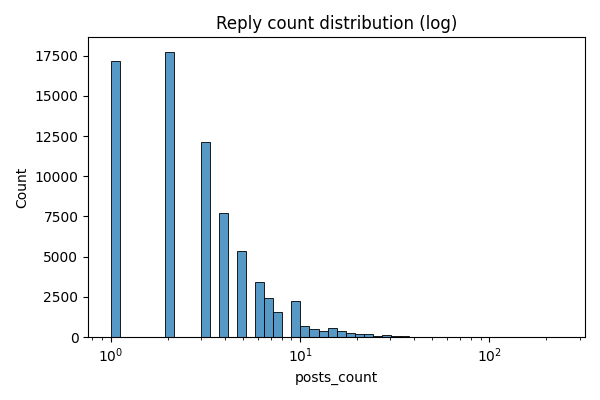
Posts over time] A --> C[Engagement Patterns
Views & replies] A --> D[Content Categories
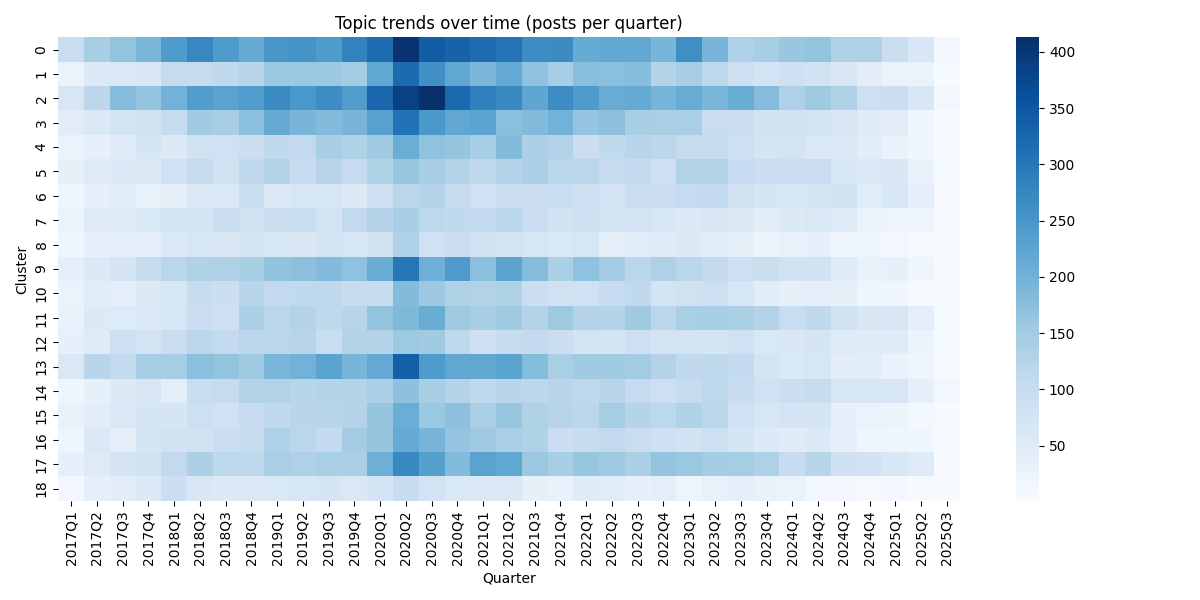
Evergreen vs trending] B --> E[Quarterly Analysis
Topic evolution] C --> F[Controversy Detection
High-reply topics] D --> G[Value Assessment
Long-term relevance]
Posts over time] A --> C[Engagement Patterns
Views & replies] A --> D[Content Categories
Evergreen vs trending] B --> E[Quarterly Analysis
Topic evolution] C --> F[Controversy Detection
High-reply topics] D --> G[Value Assessment
Long-term relevance]
Generated Insights
Detailed Results
-
Evergreen Posts
Loading evergreen posts analysis...
-
High-Engagement Posts
Loading high-engagement posts analysis...
-
Correlation Analysis
Loading correlation analysis...